Making Web Map using LeafletJS
As you all know, I am a really curious person, always scavenging the internet to learn something new about the world of tech. Lately, I have been really curious about maps on the internet, I wondered how Google or Bing create these types of maps that millions if not billions of people use every month. I wanted to learn a way to introduce myself to understand how to make web apps, without having previous knowledge of GIS (geographic information system), using a special type of JavaScript library called LeafletJS.
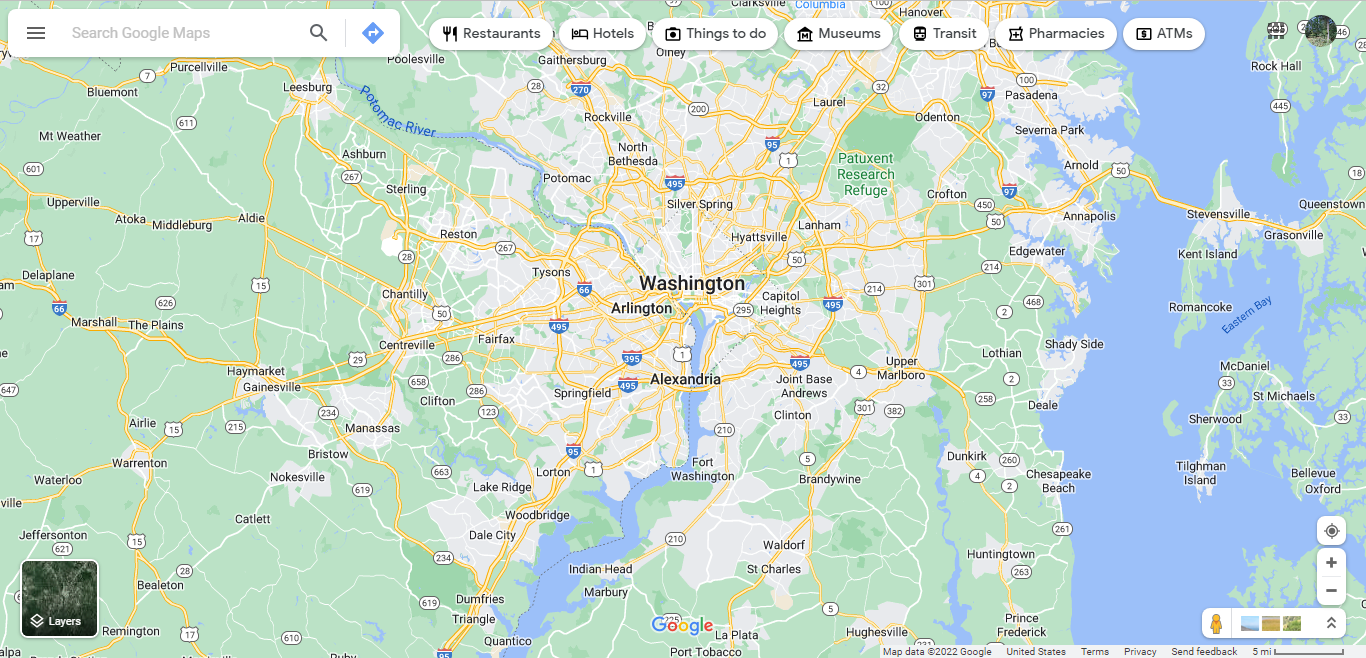
LeafletJS is an open-sourced JS library that is used to make and build web mapping applications. This library allows developers to make tiled web maps without knowing GIS, you only need knowledge of HTML, CSS, and of course, JavaScript! Some major companies and businesses trust Leaflet. Some include:
So without a further ado…let’s get started!
Installation
To get started making these web maps, we always gotta start installing all of the important necessities for the project. There are three ways to install the library:
If you have npm installed:
npm install leaflet
You will find a copy of the Leaflet release files in node_modules/leaflet/dist.
Install the package
If not, install this package, unzip it, and follow the instructions on this website.
Clone the reposittory
You can also clone the Leaflet repo from GitHub:
git clone https://github.com/Leaflet/Leaflet.git
cd Leaflet
Making the Web Map
In order to make the map, I first created an HTML file called index.html which first contained this:
<link rel="stylesheet" href="https://unpkg.com/leaflet@1.9.2/dist/leaflet.css" integrity="sha256-sA+zWATbFveLLNqWO2gtiw3HL/lh1giY/Inf1BJ0z14=" crossorigin="" />
<script src="https://unpkg.com/leaflet@1.9.2/dist/leaflet.js" integrity="sha256-o9N1jGDZrf5tS+Ft4gbIK7mYMipq9lqpVJ91xHSyKhg=" crossorigin=""></script>
This here just imports the JS and CSS files that we previously installed. Note that it is important to have written the stylesheet one FIRST before writing the script.
Then once I did all of that, I add a bit of personal styling, mainly for the size of the map:
#map {
    height: 600px;
}
Once after that, I began the most important step…bring the map to life!
This step was a bit complicated for me at first, but at the end, it was all worth it! I began by typing <script> in the same file, and wrote out this:
var map = L.map('map').setView([38.91, -77.03], 13);
L.tileLayer('https://tile.openstreetmap.org/{z}/{x}/{y}.png', {
maxZoom: 19,
attribution: '© <a href="http://www.openstreetmap.org/copyright">OpenStreetMap</a>'
}).addTo(map);
The variable map is the actual map itself, where I input the coordinates for Washington D.C. This program also uses openstreetmap.org to display the map. The second line is where I added that tileLayer from openstreetmap.org, placed a max zoom, and made attribution to openstreetmap. With all of this, it gets added to the map itself.
Results and Conclusion
The result that I got was this:
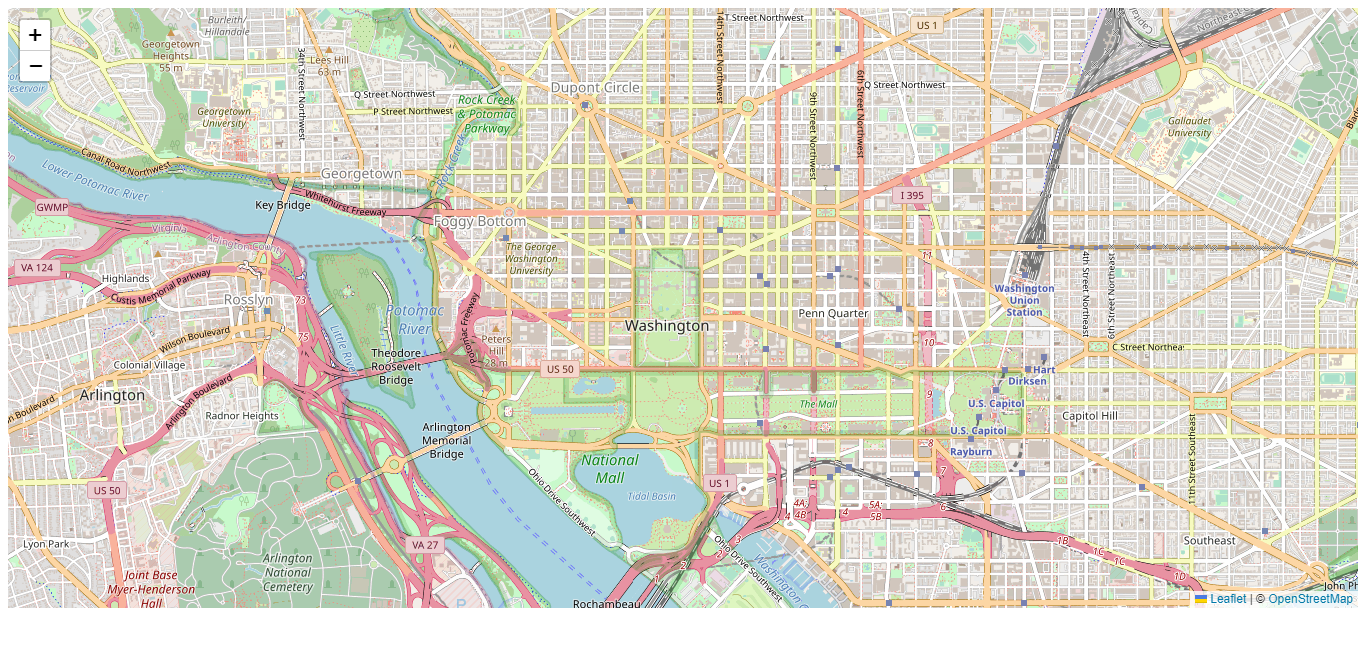
At first, I was pleased with the results. It was straightforward with a bit of help from documentation and people on Stack Overflow (of course), but I think I could add a bit more things to it that would make it ultimate:
- Adding satellite view
- Allow the user to click at a specific point to find the coordiantes
- Street View (I could use Google’s or Bing’s API)
- Directions
In the past, I made some maps similar to this, but it involved R since I was dealing with statistics. This was more of an experiment to play around with this library.
Futher links
GitHub: upcoming